

Planning and data
Custom metrics
Build your own metrics from athlete data and put them on your dashboard.
Every coach has numbers they trust. Custom metrics let you build your own from your athletes’ data, so the dashboard reflects how you coach.
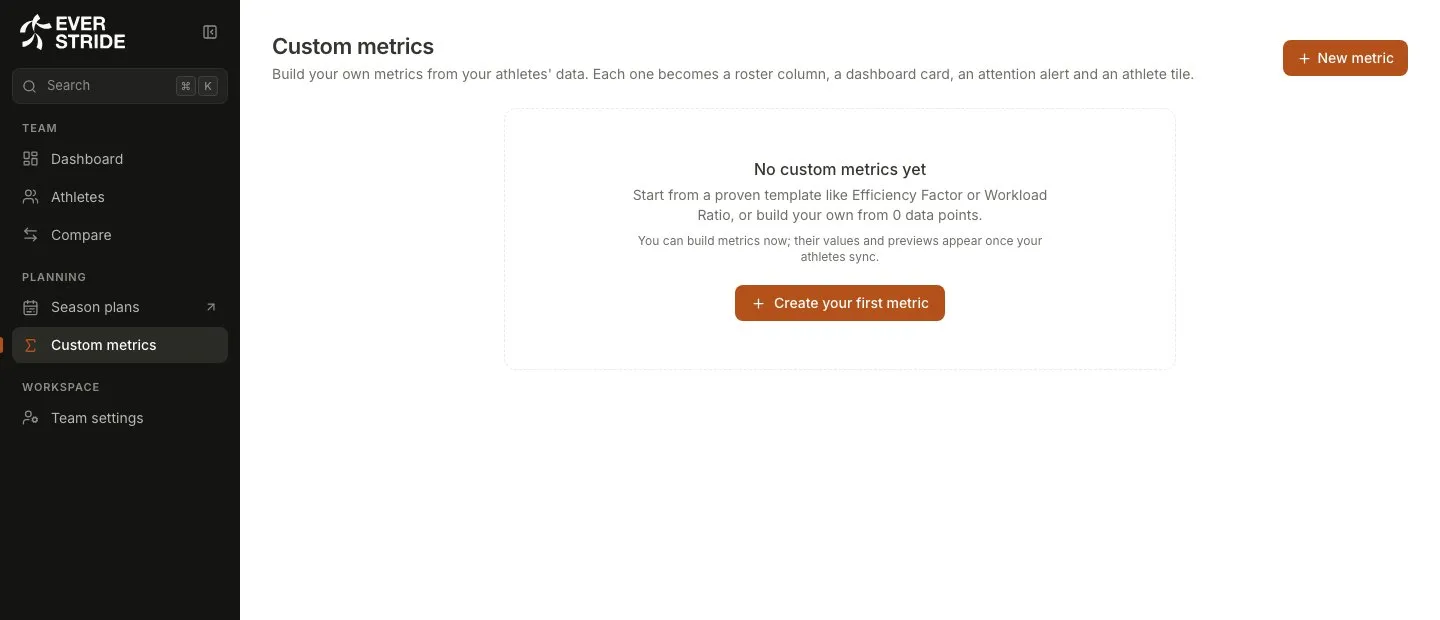
Create a metric
Section titled “Create a metric”-
Open Custom metrics in the sidebar, under Planning.
-
Choose New metric.
-
Pick how to start. There are three ways in:
- A template, such as Efficiency Factor or Workload Ratio.
- The guided builder, which combines two data points, or a data point and a number.
- A free formula, where you type your own. Data points appear as
[Label], with suggestions as you type.
-
Choose how to summarise it. Pick latest, average, total, highest or lowest, over 7, 14, 28 or 90 days.
-
Name it. Add a name, a unit, a short description, which direction is good, and how many decimals to show.
-
Add an alert if you want one. This flags athletes who cross a line you set.
-
Check the preview. You’ll see every athlete’s value, a small chart and their alert status before you save.
-
Save.
Where your metric appears
Section titled “Where your metric appears”Each custom metric shows up in several places:
- Roster: as a column, in red with a bell when its alert trips.
- Quick view: you can choose it for a card.
- Attention: alerts count as flags, and you can mute each one.
- Athlete pages: choose Show on athletes to add it as a tile. It then also appears on the athlete’s Today page, under “Your coach’s metrics”.
Why a value might be missing
Section titled “Why a value might be missing”If an athlete has no value, they may not have the data the formula needs, or they may not share that category. The builder shows how much coverage each data point has, so you can see this before you save.